Sea Surface Temperature, Clouds, and Tropical Depression/Storm/Hurricane Tracks from June 1, 2005 to August 29, 2005
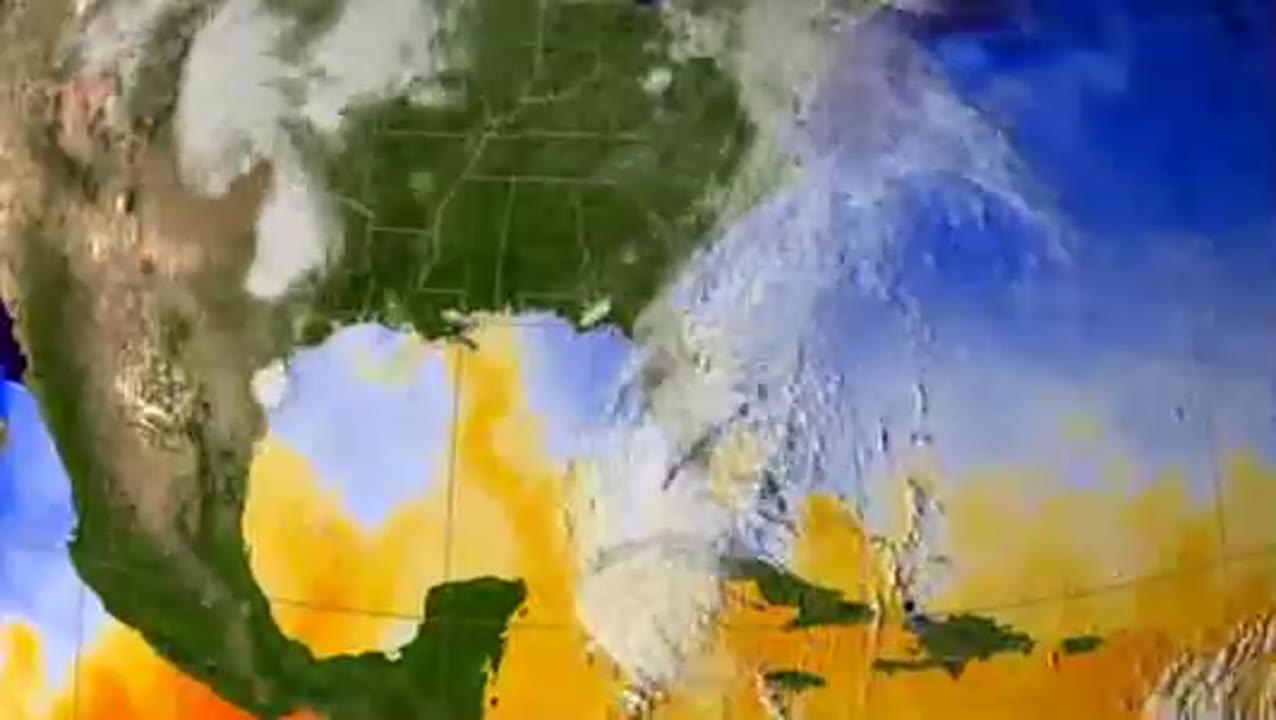
This visualization shows sea surface temperatures during the early part of the 2005 hurricane season. Overlaid are infrared cloud data and storm track data. Ocean temperatures are the fuel that drive hurricanes. Notice the correspondence between the storm tracks and the sea surface temperature re...