Missing Carbon: CO2 Growth in the last 400,000 Years
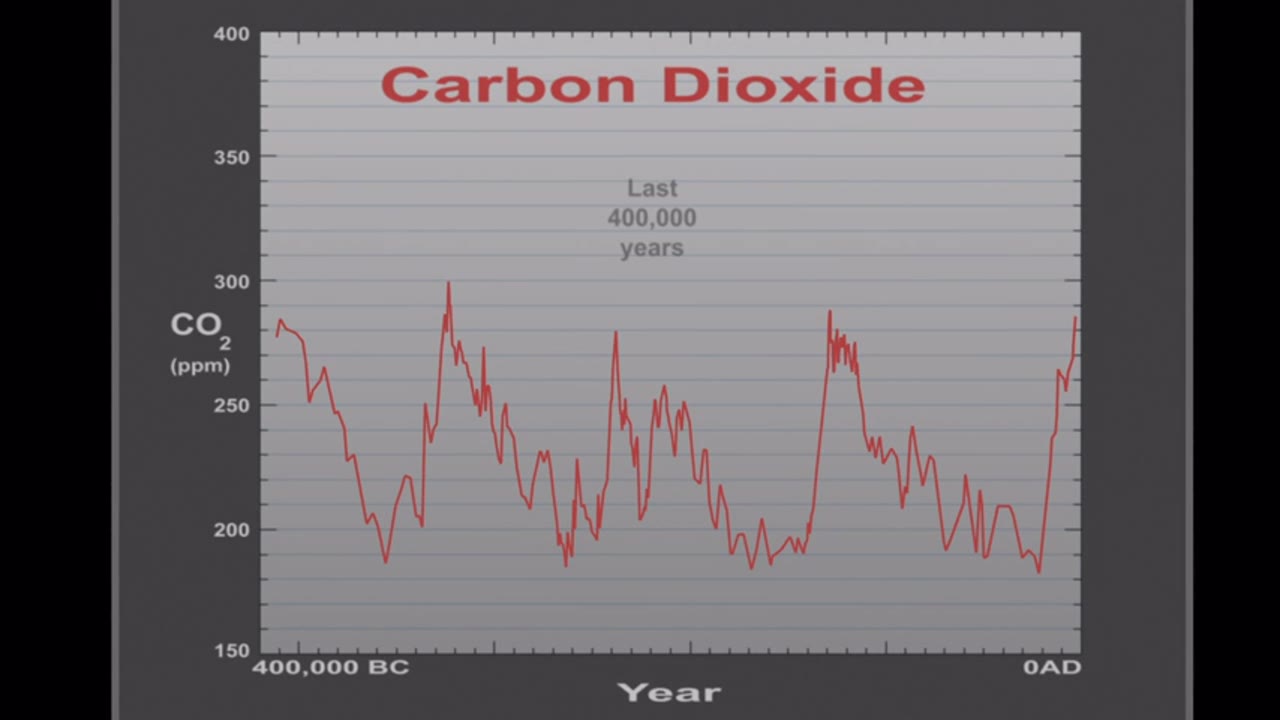
The animation shows a graph of carbon dioxide (on the y-axis) versus time (on the x-axis). First data is shown from about the last 400,000 years. Next, this graph slides to the left and a new graph slides on showing carbon dioxide from the last 1000 years. NOTE: the y-axis scale remains the same....