Hurricane Katrina Sea Surface Temperature (WMS)
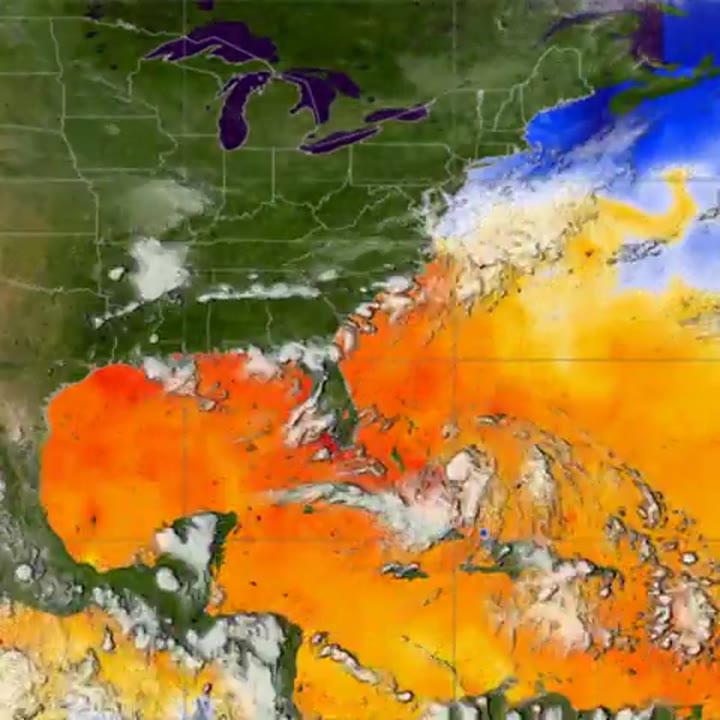
This visualization shows the cold water trail left by Hurricane Katrina. The data is from August 23 through 30, 2005. The colors on the ocean represent the sea surface temperatures, and satellite images of the hurricane clouds are laid over the temperatures to clearly show the hurricane positions...